

What is OEE?
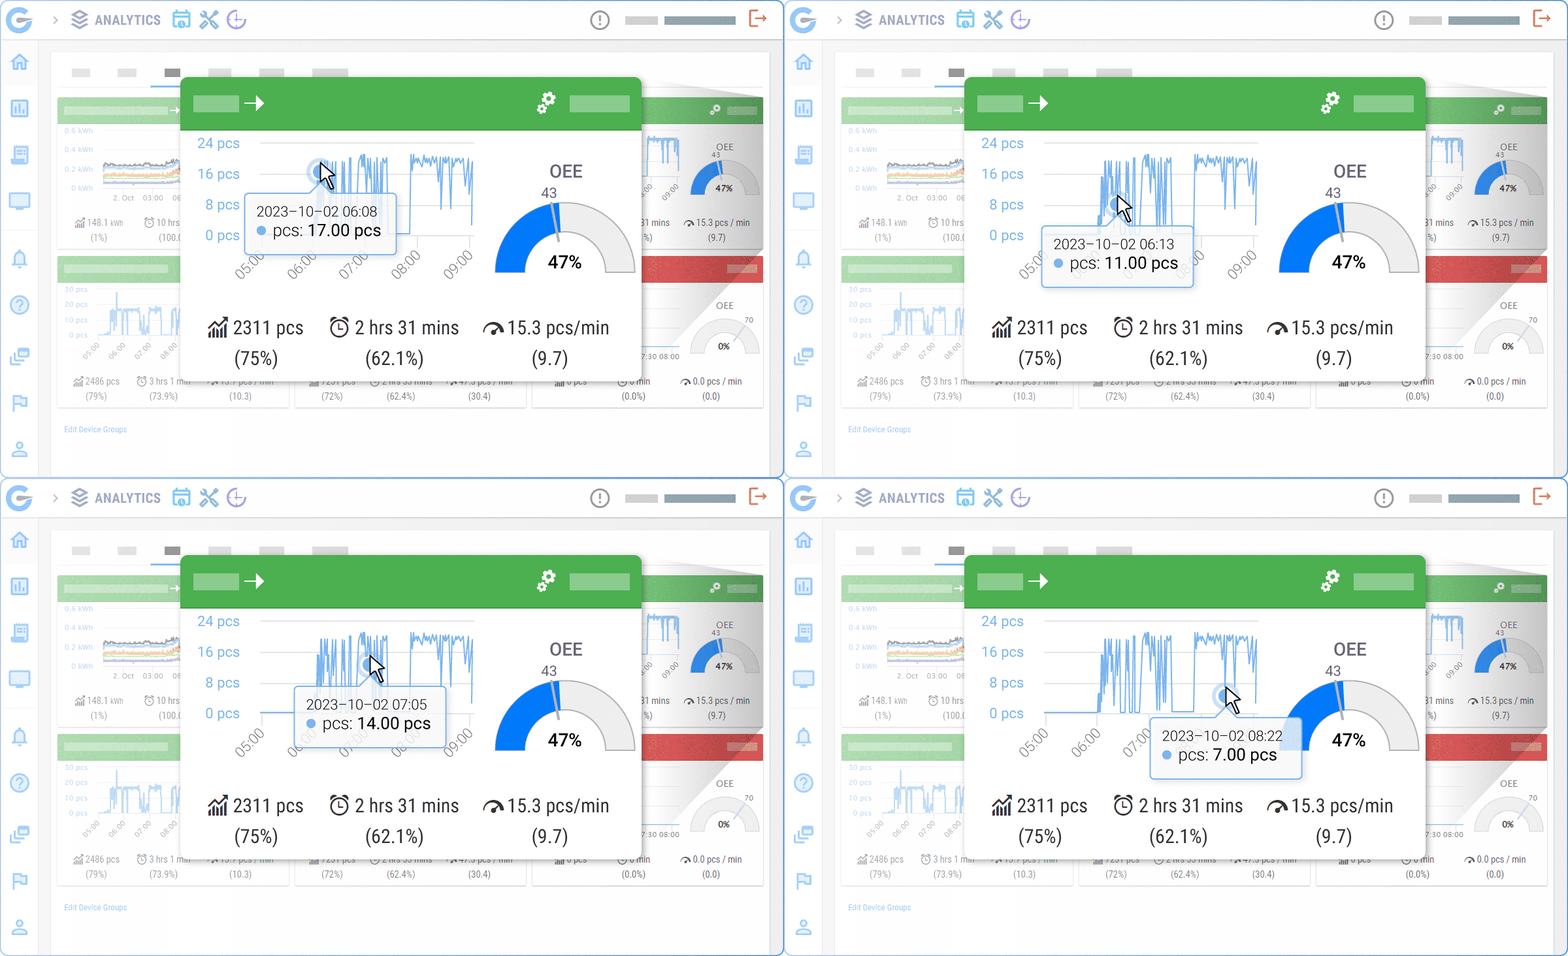
Overall Equipment Effectiveness (OEE) measures how effectively your production assets are utilized, combining Availability, Performance, andQuality into one unified metric. Today, even a 5 % lift in OEE can translate into millions saved and substantial capacity unlocked.
Yet most factories routinely lose 20–30 % of throughput to unplanned downtime, speed losses, and scrap. Using our website and our OEE software, you’ll discover exactly how to calculate and benchmark your OEE, tackle the top five barriers to sustained improvement, and see how GlobalReader’s real-time tracking, predictive maintenance, and analytics suite drives rapid returns. Ready to pinpoint your biggest losses and turn data into action?
No financial commitment. Log in, take the tour, try it out!
The Official OEE Definition According to ISO 22400
If you’ve ever searched “OEE definition”, you’ve probably noticed dozens of slightly different explanations. To clear the confusion, the international standard ISO 22400 defines OEE formally so manufacturers can calculate it the same way across every line, shift, and factory.
According to ISO 22400, OEE is the product of three KPIs:
OEE = Availability × Performance × Quality
But the value of ISO 22400 is in the precise definitions it gives each component.
The Three Pillars of OEE
Breaking OEE into its three core components helps you diagnose specific losses—and attack them with the right tools.
- Availability
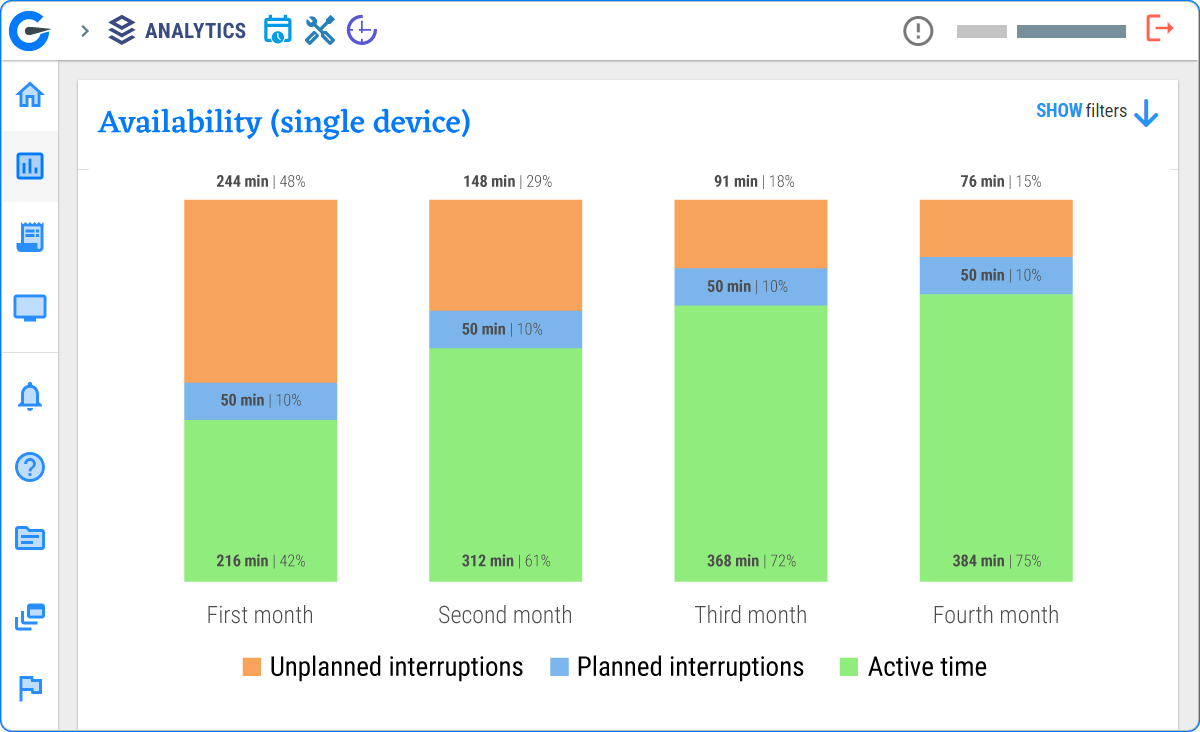
The percentage of scheduled time that equipment is actually running—downtime (both planned and unplanned) drags this down.
Learn more: Understanding the Six Big Losses in Manufacturing - Performance
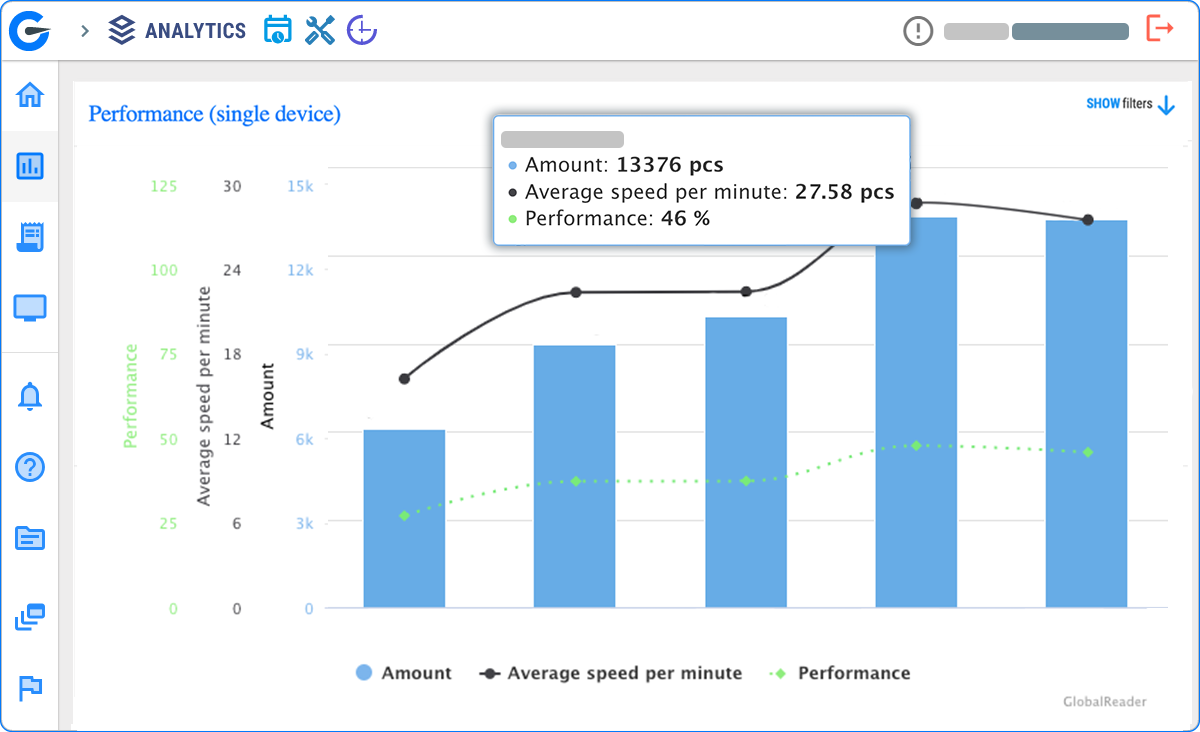
How close your run rate is to the theoretical maximum cycle time—micro-stops and slow cycles chip away here.
Read: Real-Time Factory Data for Optimal Cycle Times - Quality
The ratio of good parts produced versus total parts—scrap, rework, and rejects all count against you.
See: Cost of Quality in Manufacturing
Learn how GlobalReader dashboards visualize each pillar in real time → Just check out our FREE DEMO.See Analytics Demo
How to Calculate and Benchmark Your OEE?
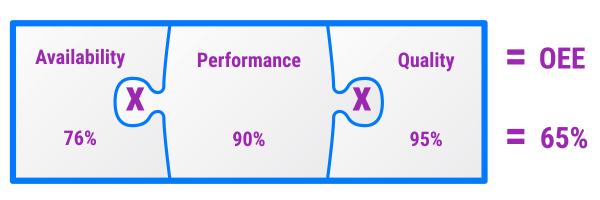
Calculating OEE is straightforward: multiply Availability × Performance × Quality (each expressed as a percentage). For example, 76% availability × 90% performance × 95% quality yields an OEE of 65%. To benchmark:
- Collect accurate runtime data
- Compute each pillar separately
- Multiply for overall OEE
- Compare vs. industry norms
Our very user friendly OEE software helps you calculate this with ease. The setup is also very easy. We provide you with hardware (sensors) that you can install yourself or ask for our help. First you start off with our Analytics tool that’s included in the Starter Bundle. You can upgrade on the go. No big financial investment needed.
Common OEE pitfalls:
- Ignoring micro-stops that add up to hours of lost production
- Using theoretical cycle times instead of actual run-rates
- Not resetting counters after planned maintenance
The Top 5 Challenges in Sustaining High OEE
- Unplanned Downtime
Equipment failures and changeovers can halt production for hours if not proactively managed. - Poor Data Collection
Manual logs and paper-based systems introduce errors and latency. - Process Variability
Inconsistent setups and variable material quality create unpredictable performance. - Siloed Reporting
When maintenance, operations, and quality use different tools, insights get lost. - Low Operator Engagement
Without real-time feedback and incentives, even the best systems fail to deliver.
This can all be solved with GlobalReader OEE software
The Culture Change
The OEE software market has shifted from basic spreadsheet tracking to real-time data collection over the past decade. Most manufacturers now expect their OEE software or MES to deliver instant visibility, not yesterday's production reports.
Market size estimates vary, but industrial analytics platforms grew roughly 15-20% annually through 2024. Factories that stuck with manual OEE tracking lost ground to competitors running automated systems that catch losses as they happen.
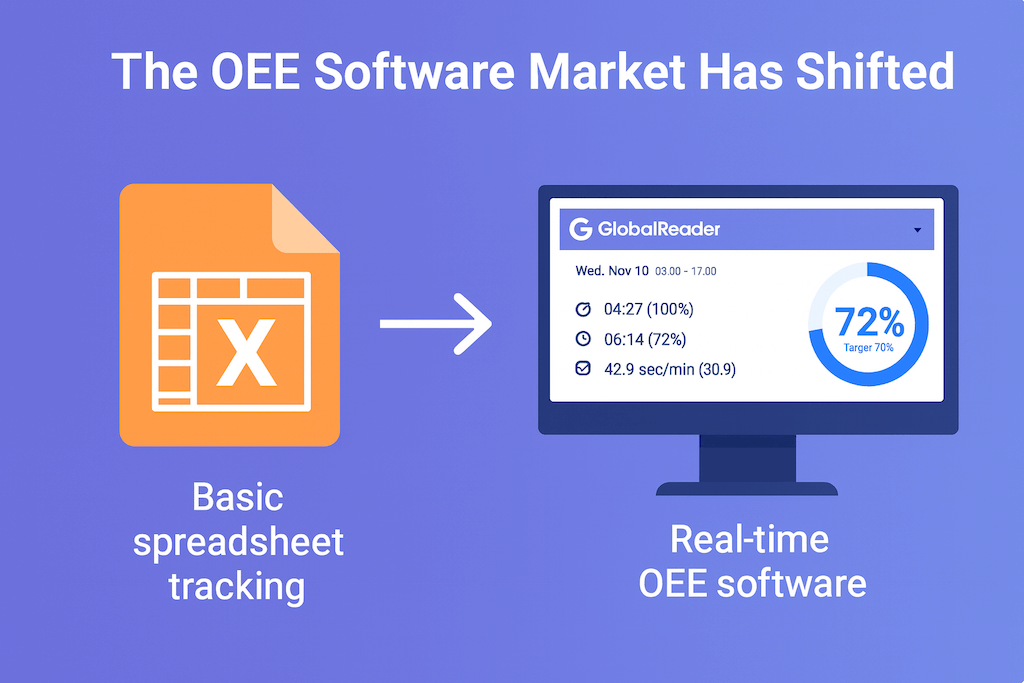
Three trends are reshaping the space:
1. Cloud-first architectures
Legacy on-premise systems required weeks of IT setup and expensive server hardware. Modern platforms like GlobalReader deploy in days, with sensors streaming data directly to secure cloud dashboards. You get remote access from anywhere, automatic updates, and no capital expense for servers.
2. Predictive maintenance integration
Standalone OEE tools just told you what broke. Today's platforms connect equipment health signals (vibration, temperature, cycle-time drift) to predict failures before they tank your availability. GlobalReader's predictive module flags anomalies 48-72 hours early, so maintenance teams can schedule fixes during planned downtime instead of scrambling through emergency shutdowns.
3. Modular, pay-as-you-grow pricing
The old model locked you into enterprise contracts with modules you'd never use. Now you can start with core OEE tracking for $200-500/month per line, then add scheduling, quality management, or advanced analytics when you're ready. GlobalReader's Starter Bundle includes real-time tracking and basic analytics with no long-term commitment. Most plants see ROI in 2-4 months and upgrade once they've banked the savings.

Where does GlobalReader fit?
We're not trying to be SAP or a full ERP replacement. GlobalReader focuses on the shop floor—tracking, analyzing, and improving OEE without the complexity of enterprise software. Our modular OEE software with IoT plugs into your machines and sends collected data to cloud where it can be merged with existing ERP and quality systems, so you get specialised production intelligence without ripping out what already works.
If you're comparing platforms, look for three things:how fast you can deploy (days, not quarters), whether predictive maintenance is included or an expensive add-on, and if the pricing scales with your growth instead of locking you into a five-year contract.

How GlobalReader Enables Continuous OEE Improvement


GlobalReader’s modular MES platform turns data into action at every step:
- Real-Time Tracking
Automated capture of run/stopped states and reason codes in seconds →/features/operator - Predictive Maintenance
AI-driven alerts on vibration, temperature or cycle-count trends →/features/maintenance - Advanced Analytics
GlobalReader turns raw production data into actionable insights. The platform identifies loss patterns across shifts, lines, and SKUs, so you can spot recurring bottlenecks instead of chasing one-off issues.What you get:
Root-cause analysis that breaks down whether a 12% OEE drop came from changeover delays, micro-stops, or quality rejects
Trend visualization showing how availability, performance, and quality shift week-over-week
Benchmarking dashboards that compare your lines against plant averages or industry standards
Most teams find two or three chronic issues eating 15-20% of their capacity. Fix those first, and you'll see gains within weeks. → /features/analytics
- Production Scheduling
Optimize sequence, capacity and changeovers for max throughput →/features/planner
Typical payback: 2–4 months, with 10–25 % OEE gains.
OEE Frequently Asked Questions
Is 100 % OEE realistic?
In practice, 100 % is unattainable—minor stops and quality fluctuations are inevitable. Most world-class plants target 85–90 % as a stretch goal.
What’s the difference between OEE and TEEP?
While OEE measures utilization of scheduled time, TEEP (Total Effective Equipment Performance) measures utilization of all calendar hours, including unscheduled time.
How often should OEE counters be reset?
Reset counters at the start of each shift or production run to keep data clean—avoid carrying over scrap or downtime from previous batches.
OEE Formula
Overall Equipment Effectiveness is calculated as the product of its three pillars:
OEE (%) = Availability (%) × Performance (%) × Quality (%)
Each pillar is expressed as a percentage (0–100 %), and the result is also a percentage.
OEE Full Form
OEE stands for Overall Equipment Effectiveness—a single metric that captures how well your manufacturing equipment is utilized relative to its full potential.
OEE Calculation Example
Imagine a machine scheduled for 480 minutes/day:
- Operating time (after downtime): 432 min → Availability = 432/480 = 90 %
- Ideal cycle time: 1 min/part; actual output: 400 parts → Performance = (400 × 1 min)/432 min = 92.6 %
- Good parts: 380 of 400 → Quality = 380/400 = 95 %
Then OEE = 90 % × 92.6 % × 95 % ≈ 79.3 %.
OEE Meaning in Production
In a production setting, OEE quantifies the real-world efficiency of your machines by combining uptime, speed and quality into one figure. It highlights exactly where you lose capacity—so you can target improvements.
OEE Performance
The Performance pillar compares actual run rate to the ideal rate:
Performance (%) = (Ideal Cycle Time × Total Pieces) ⁄ Operating Time × 100
It reveals losses from slow cycles and micro-stops.
OEE Calculator
An OEE calculator automates the formula, letting you enter uptime, cycle times and scrap counts to instantly compute each pillar and overall OEE. GlobalReader OEE software includes this and gives you the best overview of your OEE.
OEE Examples
- World-class plants often achieve 85–90 % OEE.
- Mid-tier operations sit around 60–70 %.
-
Beginner sites may start as low as 40–50 %.
Use these benchmarks to set realistic improvement targets.